Pushing to 100,000 API clients simultaneously
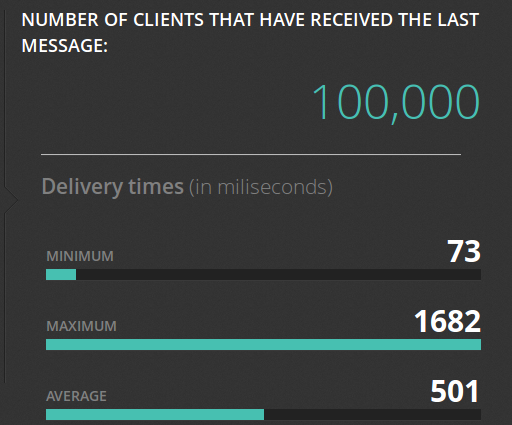
Earlier this year we announced the open source Pushpin project, a server component that makes it easy to scale out realtime HTTP and WebSocket APIs. Just what kind of scale are we talking about though? To demonstrate, we put together some code that pushes a truckload of data through a cluster of Pushpin instances. Here’s the output of its dashboard after a successful run:

Before getting into the details of how we did this, let’s first establish some goals:
- We want to scale an arbitrary realtime API. This API, from the perspective of a connecting client, shouldn’t need to be in any way specific to the components we are using to scale it.
- Ideally, we want to scale out the number of delivery servers but not the number of application servers. That is, we should be able to massively amplify the output of a modest realtime source.
- We want to push to all recipients simultaneously and we want the deliveries to complete in about 1 second. We’ll shoot for 100,000 recipients.
To be clear, sending data to 100K clients in the same instant is a huge level of traffic. Disqus recently posted that they serve 45K requests per second. If, using some very rough math, we say that a realtime push is about as heavy as half of a request, then our demonstration requires the same bandwidth as the entire Disqus network, if only for one second. This is in contrast to benchmarks that measure “connected” clients, such as the Tigase XMPP server’s 500K single-machine benchmark, where the clients participate conservatively over an extended period of time. Benchmarks like these are impressive in their own right, just be aware that they are a different kind of demonstration.
The Headline API
For the purpose of this demonstration, we created a simple API for a “headline”. The idea here is that clients can set or retrieve a text string from the headline service and be notified whenever the text changes. You could imagine the service being used by an electronic marquee.
To set the current headline value, the client makes a POST request and provides the text:
POST /headline/value/ HTTP/1.1
Content-Type: application/x-www-form-urlencoded

body=Flight%20123%20arriving%20in%20terminal%20A%2e
The server then acknowledges:
HTTP/1.1 200 OK
Content-Type: application/json

{"id": 1, "body": "Flight 123 arriving in terminal A."}
The id value acts as a version for the headline data and is incremented every time the headline is changed.
To receive the current headline value or monitor it for changes, a client issues a GET request to the same resource. In order to enable realtime, passing a last_id parameter can be used to tell the server which headline the client has last seen, and if the provided value matches the current value on the server, then the request hangs open as a long-polling request until the headline changes.
Client requests latest value:
GET /headline/value/ HTTP/1.1Server responds immediately:
HTTP/1.1 200 OK
Content-Type: application/json

{"id": 1, "body": "Flight 123 arriving in terminal A."}
Client checks for updates:
GET /headline/value/?last_id=1 HTTP/1.1Supposing that the current headline’s id is 1, the server will not immediately respond to this request. If the headline is changed, then the server will respond:
HTTP/1.1 200 OK
Content-Type: application/json

{"id": 2, "body": "Flight 123 arriving in terminal C."}
Once we designed this nice API, we implemented it as a GRIP-supporting web service so that it could be fronted by Pushpin. We won’t get in to exactly how that was done here, but you can look at the source of our Django-based implementation, and the original Pushpin announcement gives a nice overview of how GRIP works. The result is that Pushpin can power the realtime parts of the headline service and API, without knowing anything about it in advance.
EC2 Architecture
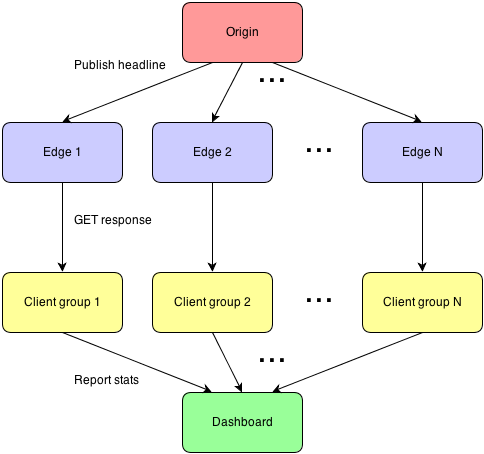
For this demonstration we are using Amazon EC2, which makes it easy to create many server instances quickly and then destroy them once the demo is complete. There are four server types:
- Origin - Runs the headline web service. EC2 instance type: m1.small.
- Edge - Runs Pushpin, with a capacity for 5000 incoming clients. EC2 instance type: m1.xlarge.
- Client “group” - Runs a special client service, acting as 5000 headline clients from a single machine. EC2 instance type: m1.xlarge.
- Dashboard - Collects statistics from clients. EC2 instance type: m1.small.
Below is a diagram to visualize how these servers are wired up:

There is exactly one Origin server (and it’s a smallish instance, even), to show that we can scale the deliveries without needing to scale the application. There is also exactly one Dashboard server, which will collect statistics from clients. It is the Edge and Client servers that are elastic. Tests showed that Pushpin installed on an m1.xlarge instance can deliver data to 5000 clients in under 1 second with reasonable consistency. For symmetry, there will be exactly one Client server (acting as 5000 clients) for every Edge server. This means that to support 100,000 clients, we’ll need 20 Edge servers. Tests also showed that we start overloading the EC2 network in the low tens of thousands of simultaneous pushes, so we distribute the Edge and Client servers out among 4 regions: us-west-1, us-west-2, us-east-1, and eu-west-1.
It could be argued that 5000 deliveries from a single server instance isn’t necessarily amazing, but we’re not trying to showcase vertical scaling here (and bear in mind that EC2 comes with its own constraints in that respect). Rather, we’re demonstrating horizontal scalability, which is the key to truly massive scaling. It’s much more important that we’re able to add many servers to the cluster than to be able to squeeze the most performance out of a single server.
Notably absent from this architecture is a load balancer. As Amazon ELB takes time to warm up to high loads, it is unfortunately not useful for a quick demonstration. And while we could have provisioned a bunch of non-ELB load balancers ready for the task, this seemed unnecessary to prove the point. So, we’re not using any load balancers at all, and Edge and Client servers are paired off instead. Basically, each Client server is configured to connect directly to a particular Edge. Client servers are always paired with an Edge in a different region so that the Internet is used for every delivery. The pairings are also balanced among all region combinations and directions in order to make the most of the network links.
In order to avoid flooding the Origin server, Pushpin has been configured in a special way on the Edge servers. In pushpin.conf, in the [handler] section, is share_all=true. This enables Pushpin’s experimental connection sharing mode, where if there is more than one incoming request to the same URL at the same time, then only one outgoing request to the origin is made. Additionally, in zurl.conf (Zurl is a dependency of Pushpin) is max_open_requests=2. This throttles outbound requests down to 2 simultaneous, so that our Origin server only ever has to handle 40 requests simultaneously (20 Edge servers x 2 requests). This is quite a bit of voodoo to get the job done, but it shows you just how tunable the system is, and provides a glimpse of where we can go with this in the future.
Source
All of the source code for this demonstration is available. The clientmanager directory contains the headline client simulator written in C++. The manager directory contains the remaining managers: originmanager, edgemanager, and instancemanager, all written in Python. The instancemanager lives on the Dashboard server and handles both EC2 instance management as well as statistics consolidation. You’ll probably have a hard time configuring and running any of the code yourself, especially as it is devoid of any documentation at the moment, but it is provided in case you’re interested in reading it.
Latency
In order to calculate delivery time, the Dashboard server periodically pings the Client servers and the Origin server, and assumes that half of the round trip time is the network latency in a single direction. When the Dashboard triggers a headline change, it starts a timer. Let S be the start time, T be the time of statistics receipt, O be the ping time to the origin, and C be the ping time to the Client server that statistics were received from, and delivery time can be calculated as: T - S - (O/2) - (C/2). Client servers batch up statistics before sending, and in that case any intentionally added latency is noted in the statistics so that it can be subtracted out in the final calculation.
“Not to 50!”

With this architecture and automation in place, testing high load is just a matter of cranking up the dial. Here’s some nice log output of the statistics compiled by instancemanager:
01:43:45.187 en=20/20 cn=20/20 ping=16/181/79 r=1 rt=73/73/73
01:43:45.288 en=20/20 cn=20/20 ping=16/181/79 r=11 rt=73/116/112
01:43:45.395 en=20/20 cn=20/20 ping=16/181/79 r=8771 rt=73/171/170
01:43:45.505 en=20/20 cn=20/20 ping=16/181/79 r=22674 rt=73/255/222
01:43:45.599 en=20/20 cn=20/20 ping=16/181/79 r=38851 rt=73/358/278
01:43:45.704 en=20/20 cn=20/20 ping=16/181/79 r=54728 rt=73/452/329
01:43:45.796 en=20/20 cn=20/20 ping=16/181/79 r=70595 rt=73/556/380
01:43:45.900 en=20/20 cn=20/20 ping=16/181/79 r=86578 rt=73/647/429
01:43:45.911 en=20/20 cn=20/20 ping=16/169/79 r=86578 rt=73/647/429
01:43:46.001 en=20/20 cn=20/20 ping=16/169/79 r=93812 rt=73/740/453
01:43:46.116 en=20/20 cn=20/20 ping=16/169/79 r=94772 rt=73/837/457
01:43:46.239 en=20/20 cn=20/20 ping=16/169/79 r=95484 rt=73/984/461
01:43:46.351 en=20/20 cn=20/20 ping=16/169/79 r=96205 rt=73/1092/465
01:43:46.423 en=20/20 cn=20/20 ping=16/169/79 r=96744 rt=73/1175/469
01:43:46.521 en=20/20 cn=20/20 ping=16/169/79 r=97461 rt=73/1247/475
01:43:46.622 en=20/20 cn=20/20 ping=16/169/79 r=98013 rt=73/1362/480
01:43:46.742 en=20/20 cn=20/20 ping=16/169/79 r=98740 rt=73/1463/487
01:43:46.843 en=20/20 cn=20/20 ping=16/169/79 r=99696 rt=73/1575/498
01:43:46.951 en=20/20 cn=20/20 ping=16/169/79 r=100000 rt=73/1682/501
The meaning of these fields are: Edge servers up/needed (en), Client servers up/needed (cn), min/max/average ping times of Edge servers and Client servers, number of clients that have received the latest headline (r), and min/max/average delivery times (rt). As you can see, the average delivery time is about half of a second, and 95% of the deliveries occurred within the first second. Not too shabby!
Got a realtime API of your own that you need to scale big? Try Pushpin yourself, or any of our other great open source tools for realtime. And if you’d rather we do the hosting dirty work, be sure to check out Fanout Cloud.
Recent posts
-
We've been acquired by Fastly
-
A cloud-native platform for push APIs
-
Vercel and WebSockets
-
Rewriting Pushpin's connection manager in Rust
-
Let's Encrypt for custom domains
 • filed under